Credit Card Fraud Detection
Abstarct
In this project I am going to develop a machine learning model to detect fraudulent transactions. It includes modeling past credit card transactions with the knowledge of the ones that turned out to be fraud. This model is then used to identify whether a new transaction is fraudulent or not. I intend to compare several algorithms along with data preprocessing approaches to detect anomalies among transactions. The Isolation Forest method proves to be a strong competitor to other classification algorithms like SVM, Naive Bayes and KNN. I hence attempt to compare the training time, prediction time and accuracies of all the algorithms.
Introduction
In the payments industry, fraud is an illegal usage of credit card details without the real cardholder’s knowledge. A stolen credit card/card number is usually the cause of a fraudulent charge. Once a cardholder sees a payment transaction he did not make on his credit card statement, he/she has the right to dispute the charge by contacting his/her bank. The bank or credit card company conducts an investigation and returns the money to the cardholder. It is important that credit card companies are able to recognize fraudulent credit card transactions so that customers are not charged for items that they did not purchase.
Dataset :
Kaggle Dataset
The dataset has been collected and analysed during a research collaboration of Worldline and the Machine Learning Group of ULB (Université Libre de Bruxelles) on big data mining and fraud detection. More details on current and past projects on related topics and the page of the DefeatFraud project.
The datasets contains transactions made by credit cards in September 2013 by european cardholders.
This dataset presents transactions that occurred in two days, where we have 492 frauds out of 284,807 transactions. It contains only numerical input variables which are the result of a PCA transformation. Unfortunately, due to confidentiality issues, we cannot provide the original features and more background information about the data. Features V1, V2, … V28 are the principal components obtained with PCA, the only features which have not been transformed with PCA are ‘Time’ and ‘Amount’.Feature ‘Time’ contains the seconds elapsed between each transaction and the first transaction in the dataset. The feature ‘Amount’ is the transaction Amount, this feature can be used for example-dependant cost-senstive learning. Feature ‘Class’ is the response variable and it takes value 1 in case of fraud and 0 otherwise.
Exploratory Data Analysis
- There are no null values
- Unbalanced dataset ; The dataset is highly unbalanced, the positive class (frauds) account for 0.172% of all transactions
- Normal : 284315 samples
- Fraud : 492 samples
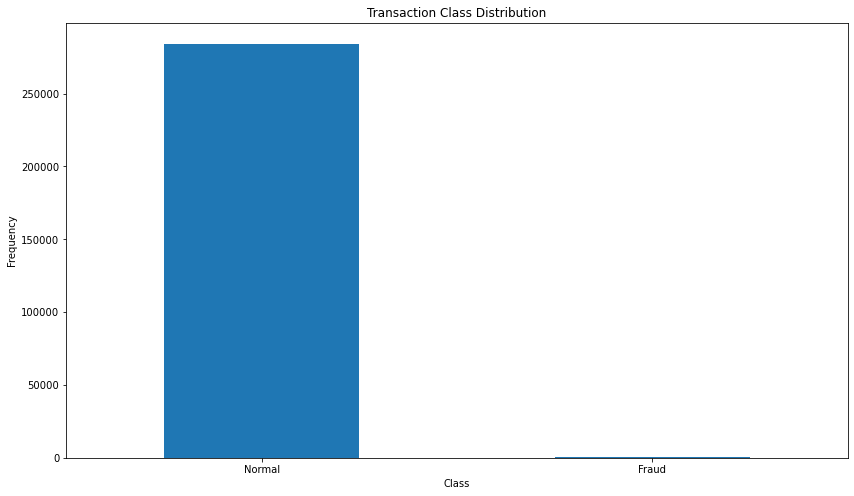 Fig. 1: Transaction class distribution
- How different are the amount of money used in different transaction classes?
![]() Fig. 2: Amount per transaction by class
Fig. 2: Amount per transaction by class
- Do fraudulent transactions occur more often during certain time frame ? Let us find out with a visual representation.
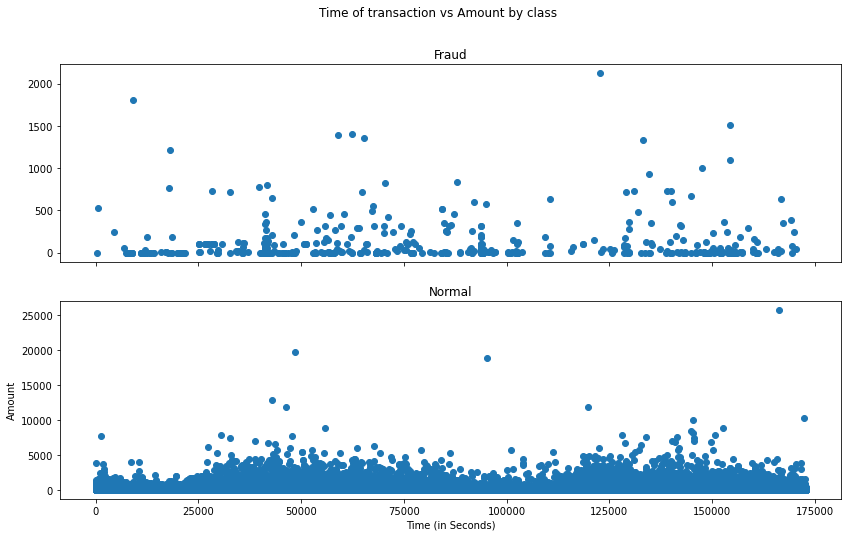 Fig. 3: Time of transaction vs Amount by class
Machine learning Algorithm
Now it is time to start building the machine learning model. The types of algorithms I ame going to use to try to do anomaly detection on this dataset are as follows :
- Isolation Forest algorithm
- Local Outlier Factor(LOF) Algorithm
- Support Vector
classifiers = {
    "Isolation Forest":IsolationForest(n_estimators=100, max_samples=len(X),
                                       contamination=outlier_fraction,random_state=state, verbose=0),
    "Local Outlier Factor":LocalOutlierFactor(n_neighbors=20, algorithm='auto',
                                              leaf_size=30, metric='minkowski',
                                              p=2, metric_params=None, contamination=outlier_fraction),
    "Support Vector Machine":OneClassSVM(kernel='rbf', degree=3, gamma=0.1,nu=0.05,
                                         max_iter=-1)
}
Isolation Forest Algorithm
One of the newest techniques to detect anomalies is called Isolation Forests. The algorithm is based on the fact that anomalies are data points that are few and different. As a result of these properties, anomalies are susceptible to a mechanism called isolation. The logic argument goes : isolating anomaly observations is easier because only a few conditions are needed to separate those cases from the normal observations. On the other hand, isolating normal observations require more conditions. Therefore, an anomaly score can be calculated as the number of conditions required to separate a given observation.
Metrics:
- Number of errors : 73
- Accuracy Score : 0.9974368877497279
- Classification Report :
| Class | Precision | Recall | f1-score | support |
|---|---|---|---|---|
| 0 | 1.00 | 1.00 | 1.00 | 28432 |
| 1 | 0.26 | 0.27 | 0.26 | 49 |
Local Outlier Factor(LOF) Algorithm
The LOF algorithm is an unsupervised outlier detection method which computes the local density deviation of a given data point with respect to its neighbors. It considers as outlier samples that have a substantially lower density than their neighbors. The number of neighbors considered, (parameter n_neighbors) is typically chosen based on :
- greater than the minimum number of objects a cluster has to contain, so that other objects can be local outliers relative to this cluster,
- and smaller than the maximum number of close by objects that can potentially be local outliers.
In practice, such informations are generally not available, and taking n_neighbors=20 appears to work well in general.
Metrics:
- Number of errors : 97
- Accuracy Score : 0.9965942207085425
- Classification Report :
| Class | Precision | Recall | f1-score | support |
|---|---|---|---|---|
| 0 | 1.00 | 1.00 | 1.00 | 28432 |
| 1 | 0.02 | 0.02 | 0.02 | 49 |
Support Vector
Metrics:
- Number of errors: 8516
- Accuracy Score : 0.7009936448860644
- Classification Report :
| Class | Precision | Recall | f1-score | support |
|---|---|---|---|---|
| 0 | 1.00 | 0.70 | 0.82 | 28432 |
| 1 | 0.00 | 0.37 | 0.27 | 49 |
Observations :
- Isolation Forest detected 73 errors versus Local Outlier Factor detecting 97 errors vs. SVM detecting 8516 errors.
- Isolation Forest has a 99.74% more accurate than LOF of 99.65% and SVM of 70.09.
When comparing error precision & recall for 3 models, the Isolation Forest performed much better than the LOF as we can see that the detection of fraud cases is around 27 % versus LOF detection rate of just 2 % and SVM of 0%.
So overall Isolation Forest Method performed much better in determining the fraud cases which is around 30%. We can also improve on this accuracy by increasing the sample size or use deep learning algorithms however at the cost of computational expense. We can also use complex anomaly detection models to get better accuracy in determining more fraudulent cases.
Conclusion
Isolation Forest Method performed much better in determining the fraud cases. This method is highly useful and is fundamentally different from all existing methods. It introduces the use of isolation as a more effective and efficient means to detect anomalies than the commonly used basic distance and density measures. Moreover, this method is an algorithm with a low linear time complexity and a small memory requirement. It builds a good performing model with a small number of trees using small sub-samples of fixed size, regardless of the size of a data set. Typical machine learning methods tend to work better when the patterns they try to learn are balanced, meaning the same amount of good and bad behaviors are present in the dataset. However Isolation Forests algorithm isolates observations by randomly selecting a feature and then randomly selecting a split value between the maximum and minimum values of the selected feature.